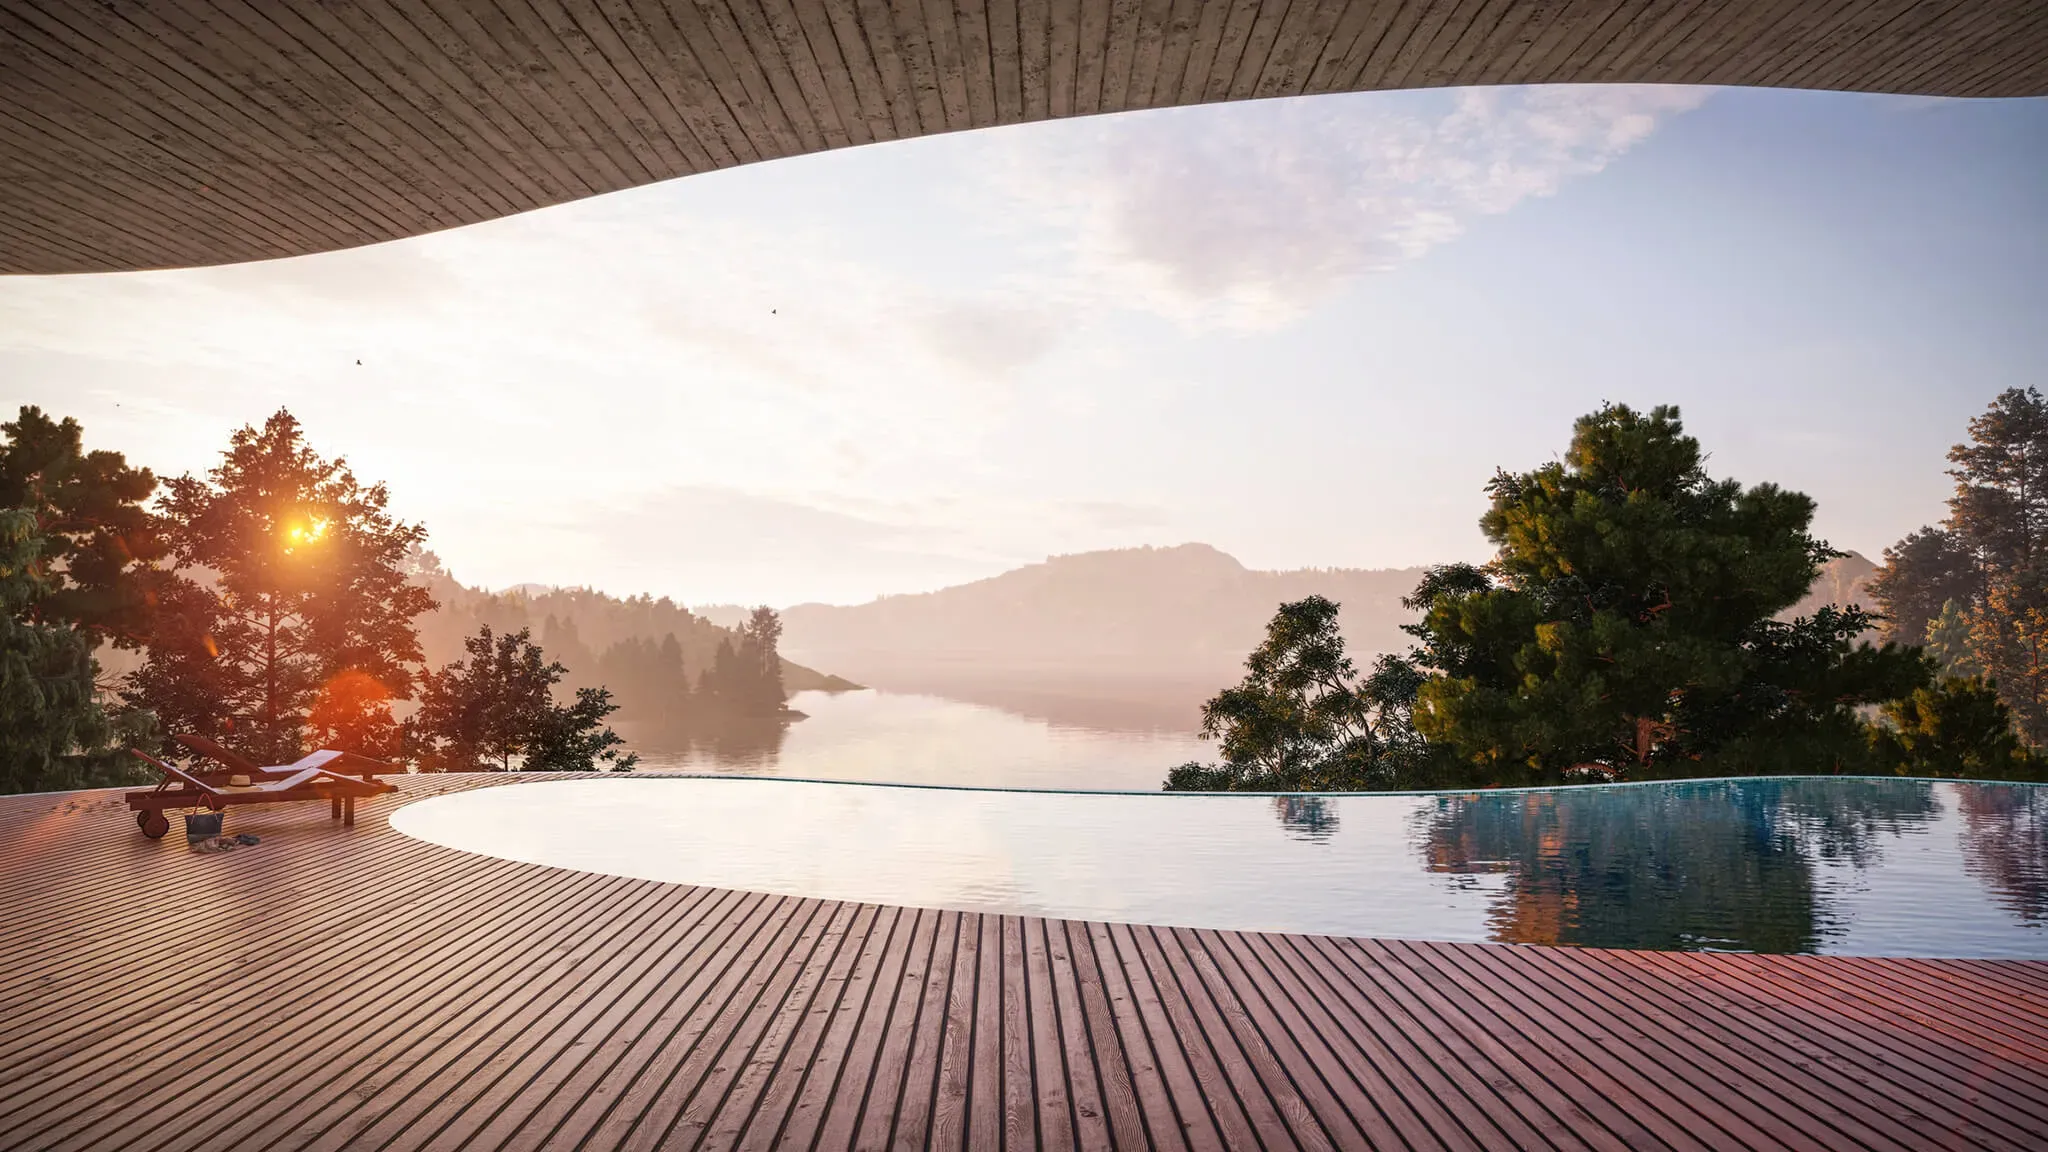
October 25, 2025Wellness or Waterpark: Choosing a Resort Development StrategyWater parks & leasure pools
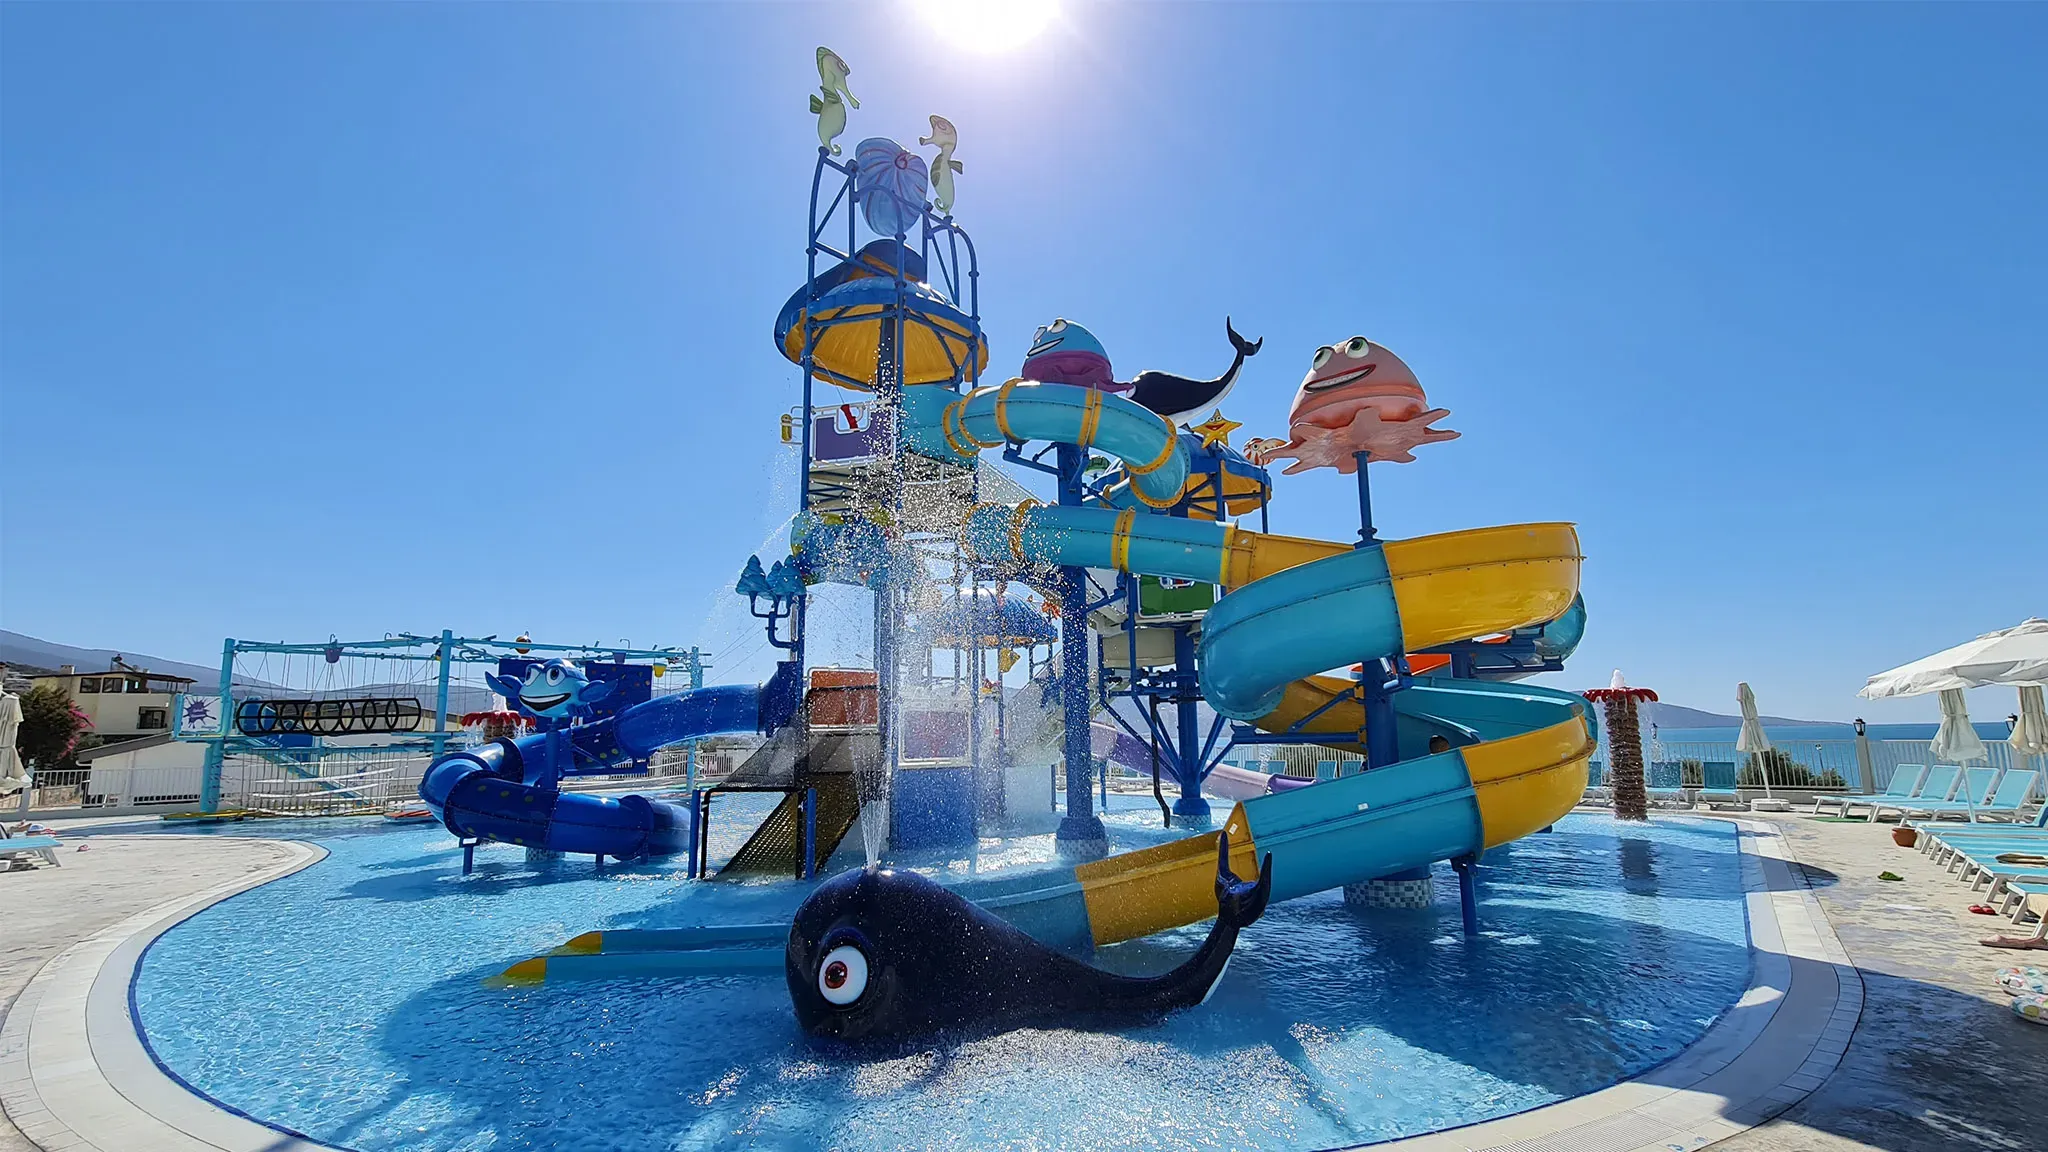
A resort water park rarely relies on a single revenue source. In practice, it operates as a portfolio of several revenue streams — tickets, food and beverage, retail, rentals, premium services — each with its own margin profile, seasonal elasticity, and capital investment requirements. A common design-stage mistake is laying out infrastructure (rides, zoning, food outlets, spa) "by intuition" or by copying another facility, rather than aligning it with a target revenue structure. A separate — and arguably the most important — variable in this model is guest dwell time, on which revenue from almost all non-ticket channels depends almost linearly. This article breaks down how much each channel contributes, why everything comes down to dwell time, and how this should shape both the infrastructure mix and pricing policy as early as the concept stage.
Based on industry analytics and our own operational management experience, the revenue structure of an average water park looks as follows:
| Revenue Channel | Approximate Share of Revenue | Notes |
| Tickets and passes | 45-55% | The base channel, but not the most profitable one |
| Food and beverage (F&B) | 25-50% | One of the highest-margin channels |
| Retail and merchandising | 10-15% | Low cost of goods, high markup |
| Cabanas, lockers, parking, premium access | 10-15% | Grows faster than other categories as the premium segment expands |
| Spa/wellness and additional treatments (for resort facilities) | additional 5–10% | Not part of the classic structure, but significant for the resort format |
Combined, non-ticket line items — so-called ancillary revenue — make up 40% to 50% of a water park's total revenue, making their management just as much a priority as managing the ticket price itself.
Tickets and Passes
Ticket sales remain the single largest revenue line — in 2023, the ticketing segment of the global water park industry exceeded $2 billion and remains the foundational revenue source, driven by format diversity (single-day tickets, season passes, group packages) and the growth of online booking platforms. According to industry estimates, ticket revenue accounts for roughly 45% of a typical water park's total income.
An important nuance: tickets generate the base visitor volume and cash flow, but they lag behind nearly every other category in margin — the cost of serving a single visitor (staff, equipment wear, ride maintenance) eats up to 50% of this revenue.
Food and Beverage (F&B) — the Second-Largest and One of the Most Profitable Channels
F&B consistently generates 25–50% of a water park's revenue. With well-managed menus, pricing, and throughput at food outlets, this channel delivers some of the highest profitability figures on-site — branded snacks, lunch packages, beverages, and souvenir items in the F&B zone yield gross margins in the 70–85% range. For comparison, average per-guest spend on food and merchandise at mid-sized amusement parks in 2025 was $18–24, against an overall average per-visitor spend of $52–62.
Retail and Merchandising
Retail sales (apparel, souvenirs, sun protection products, towels, and other related goods) account for an estimated 10–15% of revenue. This is one of the most manageable categories in terms of margin: the cost of goods is low, and demand for a "tangible memory of the visit" stays steady regardless of weather or season — unlike attendance at the water park itself.
Rentals and Premium Services: Cabanas, Lockers, Parking, Fast-Pass
Renting cabanas, lockers, and shaded areas, along with selling premium access (VIP zones, fast-pass, reserved loungers), adds another 10–15% to total revenue. In our estimation, this is one of the fastest-growing categories: as the premium visitor segment grows, per-capita spend rises without increasing the facility's physical throughput — meaning no added capital load on pools and rides.
Impact on Hotel Performance in the Resort Format
For water parks integrated into a hotel complex, the effect extends beyond the water park itself. Research from Hotel & Leisure Advisors, a consulting firm specializing in water park and hospitality industry analysis, found that after adding a water park to a hotel, a sample of seven properties saw an average revenue per available room (RevPAR) increase of 59%. The driver isn't just water park access sales, but a rise in ancillary revenue: guests who spend more time on-site spend more on food, souvenirs, and gifts. This directly parallels the logic of thermal and spa zones in hotels (see our piece on how thermal zones affect ADR): a water park doesn't function as a standalone attraction but as a tool that reshapes the entire property's economics — from room pricing to average spend per guest.
All the channels discussed above share one pattern: they depend almost linearly on how much time a visitor actually spends on-site. F&B, retail, cabana and locker rentals, premium services — none of these can physically be purchased by a guest who has already left the facility. Ticket revenue only captures the fact of entry; all further, higher-margin revenue arises exclusively during the time a guest stays. Dwell time is therefore not a secondary operational metric but the central variable around which the entire economic model of a water park should be built. Two practical requirements follow from this — for the master plan and for pricing policy.
Dwell Time Should Be Modeled at the Master Plan Stage
Visit duration cannot be left to chance — it must be built in as a calculated parameter before the architectural concept is even approved, on par with the throughput capacity of rides, rest areas, and pools. This means the master plan must provide full infrastructure for a guest's comfortable all-day stay, not just a set of water attractions:
If the infrastructure isn't built for a full day's stay, a guest physically cannot (or does not want to) remain on-site for more than a few hours — meaning the entire ancillary revenue potential, regardless of how good the rides themselves are, goes unrealized.
Pricing Policy as a Tool for Managing Dwell Time
Dwell time is shaped not only by infrastructure but also by ticket pricing structure. The key principle: the price of a short visit (3–4 hours) should be set only slightly below the price of a full-day ticket. The logic: if the price gap between a short visit and a full day is minimal, most of the target audience will start to perceive the full-day ticket as the objectively better deal — pushing the bulk of visitors toward it rather than the shorter format. As a result:
In other words, the pricing grid isn't just a way to monetize visit length — it's a tool that actively shapes it. Pricing architecture and full-day infrastructure readiness need to be designed together: a tariff that encourages choosing the full day only works in tandem with infrastructure that can physically and comfortably hold the guest for the whole day.
How to Correctly Structure the Infrastructure Mix
The revenue structure and dwell-time logic point to specific design principles for a resort water park:
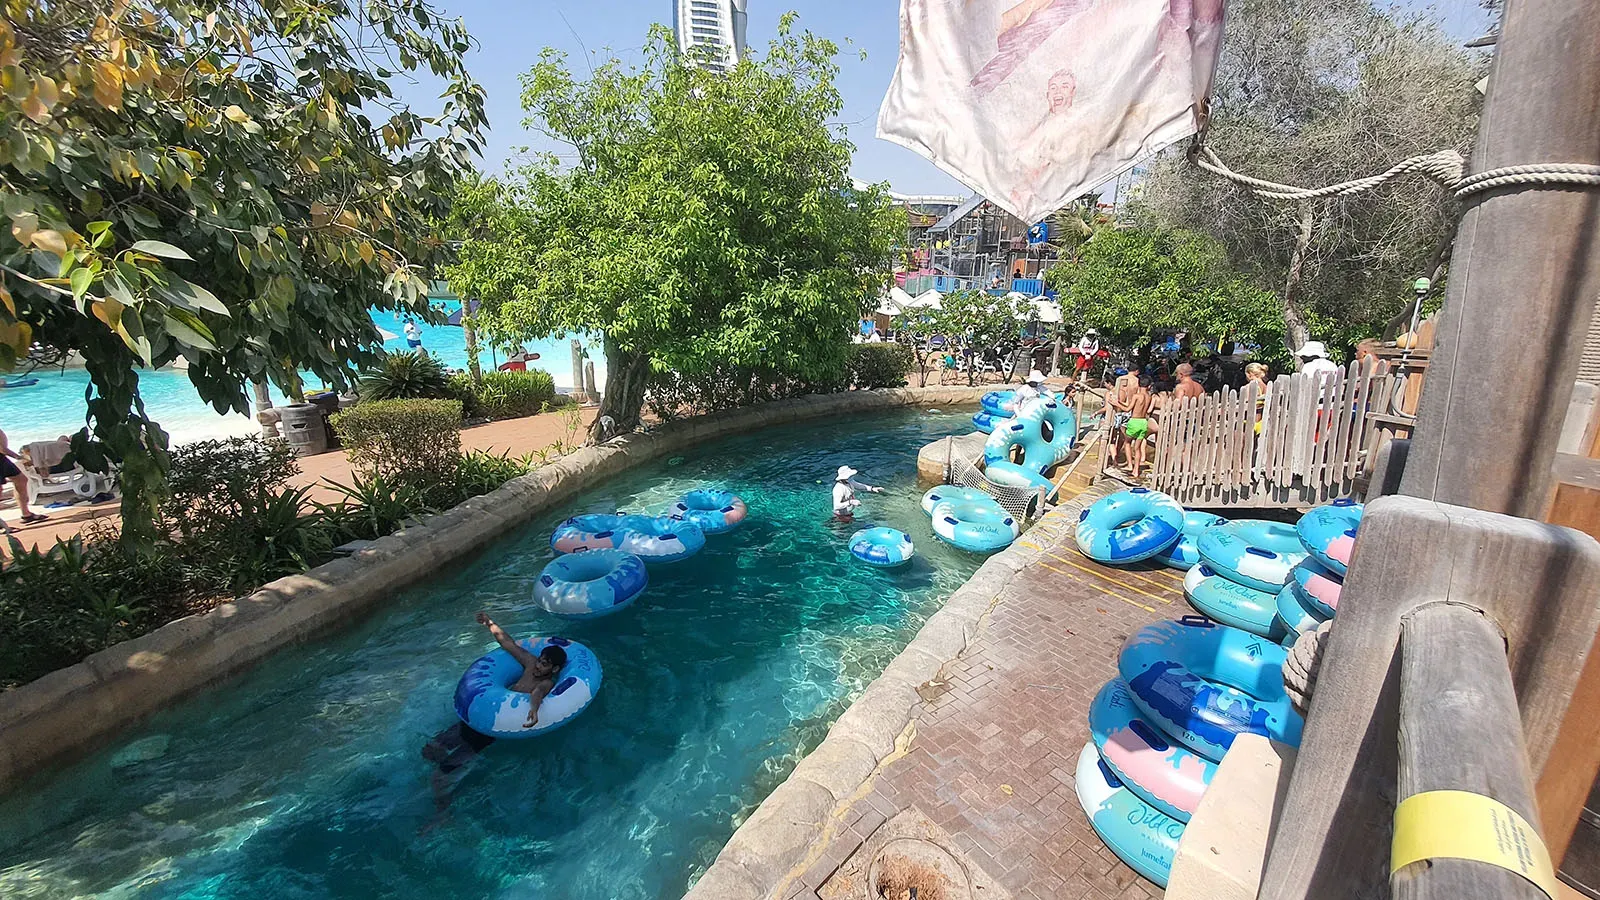
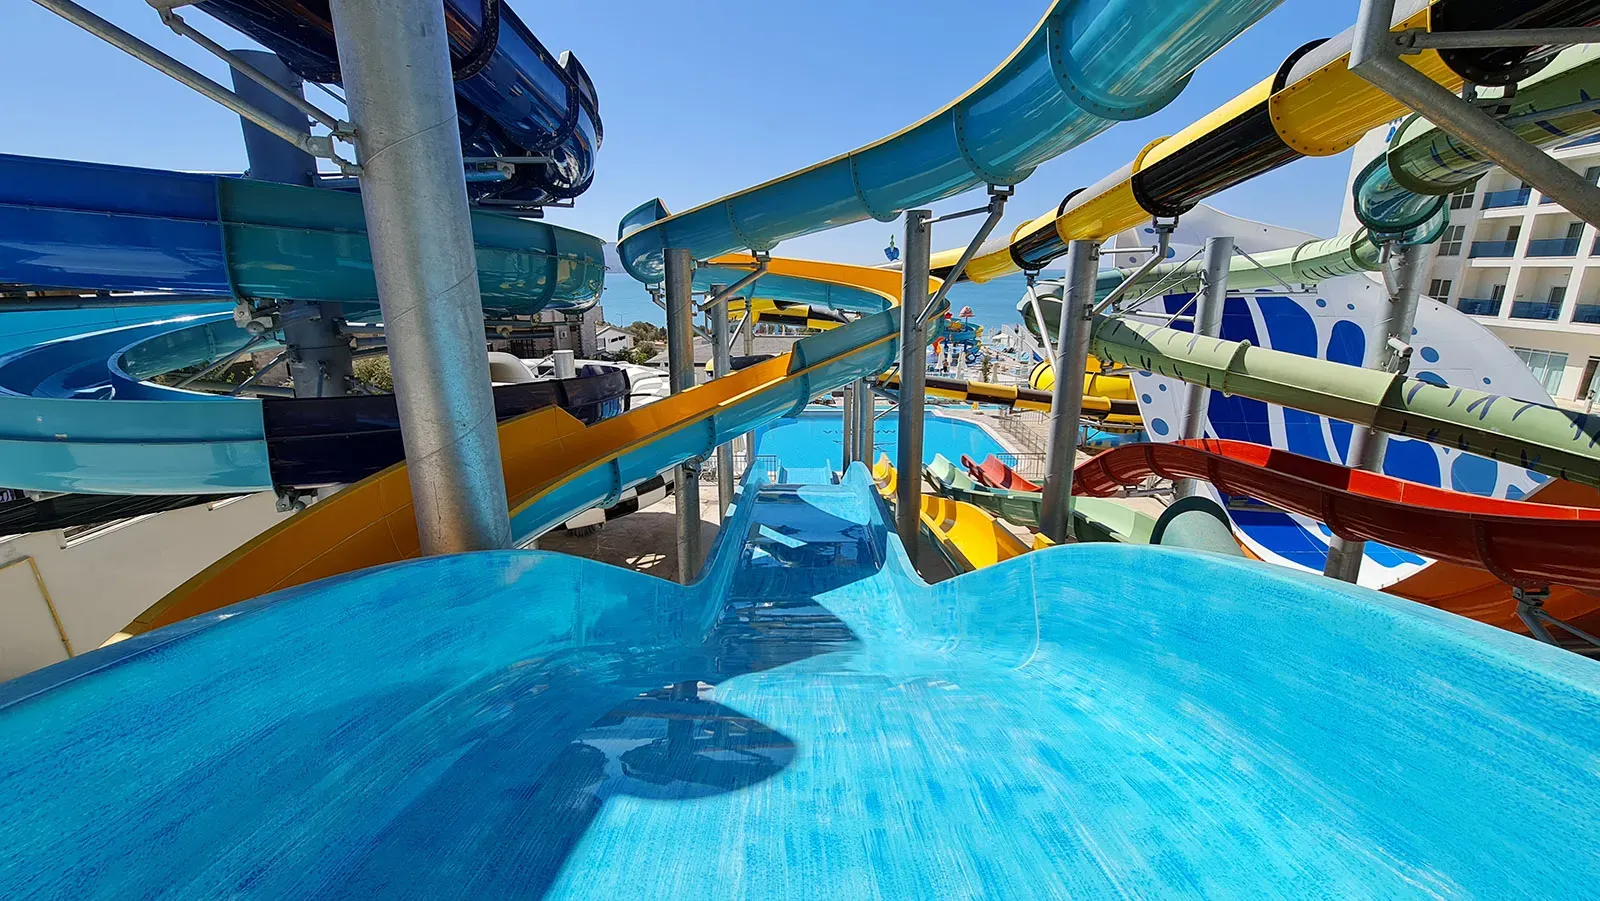
Zone by retention function, not just by ride or pool type. Active slides and wave pools drive visitor volume and ticket revenue but don't hold guests for long. Lazy rivers, kids' zones, and rest areas increase dwell time — and dwell time is what directly determines spending on food, drinks, and rentals (see the section above).
Food outlets — at the intersection of traffic flows, not as an afterthought. F&B infrastructure needs to be built into the master plan with peak throughput in mind: insufficient kitchen or cashier capacity during peak hours isn't just a queue — it's a direct loss of high-margin revenue.
Retail — near entrances/exits and in waiting areas. Impulse purchases (souvenirs, towels, sun protection) are maximized at locations with high natural foot traffic and wait times — not in separately located shops.
Premium infrastructure — as a distinct layer, not an add-on. Cabanas, VIP zones, and elevated-service areas should be planned as a standalone architectural layer with separate access control — this allows the premium demand segment to be managed independently of the base ticket flow.
Spa/wellness component — for the resort format and off-season demand. Integrating a wellness zone (thermal pools, saunas, spa treatments) broadens the target audience beyond families with children and creates an additional revenue source during the low season, when classic water attractions see less demand.
Event and banquet infrastructure. Spaces for corporate events, birthdays, and group gatherings allow the facility to be monetized during low-attendance periods and fill infrastructure outside of peak hours.
Practical Takeaways for Developers
Ticket revenue sets visitor volume, but not profitability — capital budgets during design should not be disproportionately directed toward rides and pools at the expense of F&B, retail, and premium-segment infrastructure. Ancillary line items (F&B, retail, rentals, premium access) can together account for up to half of a facility's total revenue — and therefore deserve the same careful planning of space and throughput as the water attractions themselves. Guest dwell time is the central parameter of the model: it should be calculated at the master plan stage and supported by infrastructure designed for a comfortable all-day stay, not just peak attraction attendance. The pricing grid should be designed as a tool for managing dwell time: a minimal price gap between a short (3–4 hour) ticket and a full-day ticket encourages guests to choose the full day, increasing both time on-site and spend on higher-margin additional services. For resort facilities with a hotel component, the water park is not a standalone business unit — it's a tool for influencing the whole hotel's performance metrics (ADR, RevPAR, length of stay). Infrastructure that extends a guest's time on-site (rest areas, wellness, event spaces) directly drives growth in average spend — and should be built into the project with the same priority as flagship attractions.
Sources